
 Light commercial vehicle values rose for the third consecutive month to reach a new highpoint in April according to BCA’s latest Pulse report.
The average April figure of £4,998 for all LCVs was the highest on record for any month since Pulse began reporting in 2005. Values rose by £138 (2.8%) compared to March.
There was some good news, in terms of value for money — unlike previous months, where both average age and mileage have increased along with price, in April, average age was unchanged at just under 59 months, while average mileage fell back by nearly 4,000 miles.
However, although mileage fell back from March, both age and mileage were broadly the same as in April 2012, despite a 17% increase in the average value over the last year:
| All vans | Avg Age | Avg Mileage | Avg Value | Sale vs CAP |
| Apr 2012 | 57.37 | 77,736 | £4,271 | 98.96% |
| Apr 2013 | 58.78 | 76,999 | £4,998 | 101.38% |
Data courtesy of BCA (www.british-car-auctions.co.uk)
Year-on-year, April 2013 was ahead by £727 or 17.0%, with age rising and mileage falling over the period.
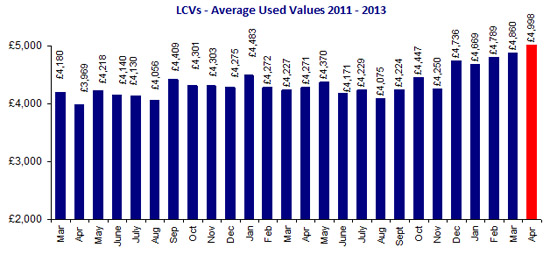
Average used LCV values at auction, March 2011 – April 2013 (courtesy of BCA).
Commenting on the figures, BCA’s Duncan Ward said:
“April has continued the pattern seen over recent months with demand virtually across the board from smaller car-sized vans up to large long-wheel base panel vans. Condition and presentation remain important, and high mileage may discourage some bidders, but overall average values and conversion rates remain very strong.
In the current market, the limited supply and levels of demand in the remarketing sector have seen prices rise for corporate stock and older dealer part-exchange vans. Anecdotal evidence from a number of sources suggests retail used van activity remains slow, yet the wholesale remarketing sector is relatively strong. LCV values have been universally strong throughout the first third of this year and are significantly higher than the same period last year.”
Values in the fleet & lease LCV sector improved again in April, rising by £264 (4.4%) to £6,171 – the first time average monthly values for corporate LCVs have been above £6,000. Values have risen every month bar one since last August. Performance against CAP fell back by nearly two points to 100.9%, while retained value against Manufacturer Recommended Price improved to 37.17% from 35.43% in March.
Year-on-year, the value evolution for corporate stock remains significant – April 2013 was £1,063 (20.8%) ahead of the same month in 2012 – with average age and mileage down over the year.
Year-on-year table: Fleet & lease vans
| Fleet/Lease | Avg Age | Avg Mileage | Avg Value | Sale vs CAP |
| Apr 2012 | 44.49 | 70,379 | £5,108 | 99.14% |
| Apr 2013 | 43.39 | 66,805 | £6,171 | 100.92% |
Data courtesy of BCA
April part-exchange van values were also the highest since Pulse began reporting in 2005, increasing by £114 (3.4%) compared to March. CAP comparisons at 102.7% continue to outperform the fleet & lease sector, while year-on-year values remain well ahead by £634 or 22.9%, with average age and mileage relatively static compared to a year ago.
Year-on-year table: Part-Ex vans
| Part-Ex | Avg Age | Avg Mileage | Avg Value | Sale vs CAP |
| Apr 2012 | 79.24 | 91,140 | £2,759 | 98.23% |
| Apr 2013 | 79.01 | 91,144 | £3,393 | 102.70% |
Data courtesy of BCA
Where next for prices?
As these figures show, used van prices have been going through the roof, rising by around 20% over the last year for vehicles with near-identical ages and mileages.
The law of supply and demand is in evidence here, and it could be several years before increased new registrations start to have a positive effect on the used market.
Pingback: Used Van Values Drop 2.5% In May – BCA - Van News: The VanRental.co.uk Blog
Pingback: Van Registrations Up 11.2% So Far This Year - Van News: The VanRental.co.uk Blog
Pingback: Used Van Values Flatline In July: Still Up 12.8% On Last Year - Van News: The VanRental.co.uk Blog