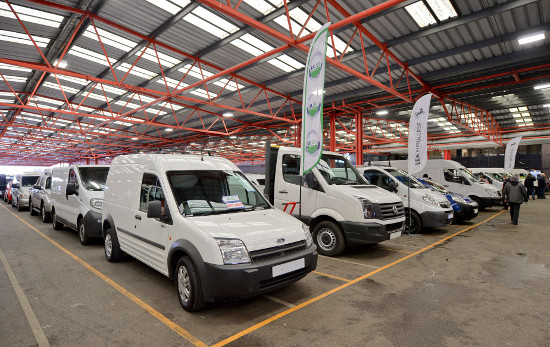
The average used price for used vans and other light commercials sold at BCA in January was £5,901. That’s 1.5% more than in December and 8% more than in January 2015, according to the latest figures from the auction specialist.

These headline prices don’t tell the full story, however. The relentless rise in new van sales over the last few years appears to be feeding through into the used market. Vans sold by BCA during January were on average five months younger than those sold in January 2015:
| All vans | Avg Age (mnths) | Avg Mileage | Avg Value | Sale vs CAP |
| Jan 2015 | 59.55 | 79,676 | £5,460 | 101.71% |
| Jan 2016 | 54.94 | 73,881 | £5,901 | 101.21% |
Data courtesy of BCA
Given the lower average mileage and age, higher prices are not surprising. The fact that the sale vs CAP (book) price has remained almost unchanged suggests to me that used prices are probably fairly flat, in real terms.
Market conditions to appear to be buoyant, however. There doesn’t seem to be any softening in demand for used vans as a result of higher levels of new sales.
Commenting on the figures, BCA’s LCV Operations Director, Duncan Ward said:
“January saw strong levels demand for LCVs at BCA and a buoyant marketplace as average values climbed. The overall sentiment from trade buyers is that retail demand is good and this is keeping the auction halls busy as they compete for stock. Over recent months we have seen a better mix of product available for buyers with a wider choice and less duplication of models. This, combined with a reduction in the overall age and mileage profile, resulted in healthy average selling prices during January.”
“If we see a similar model mix going forwards, we expect February and March to be relatively strong for LCV residual values, based on our experience from previous years. However, there are signs of a two tier market developing as the best presented and specified vans typically outperform the market by some margin, while higher mileage or damaged examples can struggle to attract attention from the buyers. It underlines the importance of appraising and valuing vehicles sensibly and in line with market expectations.”
What’s happening in the fleet sector?
Interestingly, in the largest volume sector of the market, fleet and lease vans, the changes in average age, mileage and sale price were much smaller:
| Fleet/Lease | Avg Age (mnths) | Avg Mileage | Avg Value | Sale vs CAP | Sale vs MRP |
| Jan 2015 | 42.47 | 71,320 | £6,478 | 100.70% | 38.38% |
| Jan 2016 | 42.60 | 69,351 | £6,620 | 100.90% | 34.56% |
Data courtesy of BCA
Here we can see that average age is almost unchanged, at 42.6 months, while average mileage has only fallen by 2,000. Prices are much flatter too, with only a 2.2% year-on-year increase to £6,620. However, this is well below the all-time fleet and lease high of £7,049 seen in March 2014.
The only factor that did change significantly is the Sale vs MRP (manufacturer’s retail price), which fell from 38.4% to 34.6%. This suggests to me that the underlying trend is downwards — used buyers are paying less relative to the cost of a new van. However, this change seems to be happening at a very moderate pace. I don’t think it’s a big concern at the moment.
