
New registrations of commercial vehicles — a good indicator of sales — rose by 11.5% to 43,684 in March, continuing February’s increase.
CV registrations rose by 11.5% in March, compared to March 2012, according to the latest figures from the Society of Motor Manufacturers and Traders (SMMT). As we saw in February, the biggest increases were in the Pick-up category (up 29.2%) and the vans under 2.0t (up 22.8%).
Also on the up were vans between 2.5t and 3.5t, which rose by 8.8%. This is by far the largest category of vans, and accounted for 23,483 of the 43,684 vans sold last month. This class includes vans like the Ford Transit, Vauxhall Vivaro and Mercedes Sprinter — van that form the backbone of van hire fleets and courier businesses and are commonly used by tradesmen, the construction industry and many company fleets. (A whopping 10,025 of the 23,483 2.5t – 3.5t vans sold last month were Ford Transits, underlining the ongoing dominance of this great van.)
Such a solid increase in new registrations for this category may suggest that these businesses are seeing an improvement in economic conditions or in credit availability. Alternatively, it could just be that the poor supply and rising prices of nearly-new used vans are making buying new more attractive than buying used.
Trucks reversing
In contrast to the more buoyant van registration figures, rigid truck registrations (3.5t – 32t) continued to drop in March, although artic sales remained steady. The biggest drop was in small rigids (3.5t – 6.0t), where registrations fell by 37.2%, in a potential reversal of last year’s 28.8% increase in registrations for this previously unpopular category.
With a quarter of the year gone, and the new registration plate and government budget under out belts, I think the year-to-date figures are the best way of comparing registrations from the last two years:
| Year-to-date | YTD-13 | YTD-12 | % change |
| Pickups | 8,443 | 6,266 | 34.7% |
| 4x4s | 2,005 | 2,156 | -7.0% |
| Vans <= 2.0t | 12,525 | 10,502 | 19.3% |
| Vans > 2.0 – 2.5t | 9,127 | 8,437 | 8.2% |
| Vans > 2.5 – 3.5t | 36,782 | 34,327 | 7.2% |
| All Vans to 3.5T | 68,882 | 61,688 | 11.7% |
| Rigids > 3.5 – 6.0t | 1,699 | 2,190 | -22.4% |
| Rigids > 6.0 – 16t | 2,097 | 2,729 | -23.2% |
| Rigids > 16t | 2,782 | 3,418 | -18.6% |
| All rigids | 6,578 | 8,337 | -21.1% |
| 2-axle artics | 593 | 545 | 8.8% |
| 3-axle artics | 2,889 | 3,198 | -9.7% |
| All artics | 3,482 | 3,743 | -7.0% |
Figures courtesy of SMMT.
It is perhaps not a surprise that pick-up sales have taken off so well this year — not only have several new models (e.g. Ford Ranger, Great Wall Steed) gone on sale during the last twelve months, but we’ve also had above-average amounts of snow — always a good way to convince people, often mistakenly, that they need a four-wheel drive. (Of course, what they often need is a bog standard vehicle with winter tyres…)
Pick-ups remain popular thanks to the tax benefits they offer for business owners, too, although this trend seems to be fading away in the area where I live.
This graph shows how sales have increased in the first quarter of this year compared to the same period of 2012:
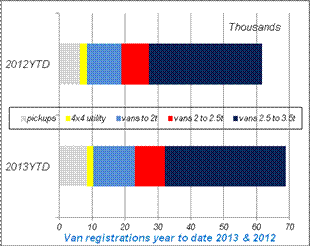
Van registrations Q1 2012 vs Q1 2013 (courtesy of SMMT)
It’s a promising start to the year, although I do have some concerns over the durability of the gains, especially when truck registrations are declining sharply, suggesting that underlying economy activity and growth remains weak.